1. Model of myoglobin at high resolution. Only the a -carbon atoms are shown. The heme group is shown in red. relatively invariant positions, insertions and deletions in the rest of the globin are indicated by the special symbols as shown in the legend.
2. The peptide group is a rigid planar unit. Standard bond distances (in C ) are shown. See figure 3 for a description of R group.
3. The structure of the side chains of the twenty amino acids. The single letter abbreviation is shown at the position of the alpha carbon.
4. Stereoscopic drawing of metmyoglobin. Skeleton. The heme is shown in red. (a) Only the a -carbons are shown in conjunction with the side chain of HIS 8F and the heme. Note the large empty space at the bottom of the heme. (b) Viewed along the b axis. Note that the helices A and D have no direct contact with the heme
5. Stereoscopic drawing of metmyoglobin. (a) Including all polar side chains and excluding tyrosines. All side chains expect threonine 4C, histidine 5B, 7F and 8F and serine 9G are exposed to the solvent. (b) Hydrophobic side chains including tyrosines and tryptophans. Note that many hydrophobic side chains are at least partly exposed to the solvent.
6. X-Ray diffraction pattern of myoglobin. At top is a photograph of a normal crystal. At bottom is a photograph in which patterns of normal crystal and one labeled with heavy atoms are superimposed slightly out of register. Comparison of the differences in density between two sets made it possible to determine phase X-Ray reflections.
7. (a) Tertiary structure of myoglobin as deduced from the 6-C . Fourier synthesis. (b) The course of the polypeptide chain, deduced from the 2-C . Fourier synthesis.
8. (a) Stereoscopic view of electron density of metmyoglobin. (b) View along the b axis showing the heme at the center-right.
9. The heme group in myoglobin.8 (yellow for Fe, blue for N, red for O and black for C).
10. The iron atom in heme binds to the four nitrogens in the center of the protoporphyrin ring.8
11. The iron atom in heme can form six bonds.8
13. Structural model for myoglobin denaturation. Ferric myoglobin oxidizes and loses heme, yielding apomyoglobin in the N state. Unfolding occurs in two stages: partial unfolding of the native apoprotein (N) to a molten globule intermediate (I) and then complete disruption of all the helical segments to yield the unfolded (U) state.
14. A triangular potential waveform with switching potentials at 0.8 and -0.2 V vs. SCE.

15. Cyclic voltammogram of 6mM K3Fe(CN)6 in 1M KNO3.7
6_in_1M_KNO3_low_resolution.png "Figure 15 - Cyclic voltammogram of 6mM K3Fe(CN)6 in 1M KNO3")
16. Instrument for voltammetry.2
![]()
17.1 Basic Circuits.1(a) Scaler/Inverter (b) Adder (c) Current Follower
17.2 Basic Circuits1 (d)Voltage Follower (e)Voltage Integrator
18.A. Current loops cause ground problems when a series of instruments are connected to ground separately (use of three-prong plugs).
B. Current loop problems can be eliminated when a series of instruments are connected to ground through one common source by the use of three to two plug adapters for all instruments expect for one.
19. The basic potentiostat for cyclic voltammetry.
20. Ag/AgCl reference electrode.
22. Effect of ohmic drop on cyclic voltammogram.
1. Nearly ideal cyclic voltammogram
2. Voltammogram with ~100 mV iR drop at the peak potential
23. Concentration-distance profile for voltammetry in a stirred solution.
a) E positive of Eο' so CO/CR > 1000
b) E = Eο'
c) E negative of Eο' so CO/CR < 1000
24. Helmholtz "double-layer" model. The excess charge on the metal will be neutralized by a monomolecular layer of ions of opposite charge to that on the metal phase. This model does not account for the possible specific adsorption or random motion of ions.
25. Guoy-Chapman "diffuse-layer" model. The random motion of ions results in a diffuse layer of charge in which the concentration of counter ions is greatest next to the electrode surface and decreases progressively until a homogeneous distribution of ions is present in the bulk solution.
26. Guoy-Chapman-Stern model. The metal-ion interaction is strong, and the specifically adsorbed charge may exceed the positive charge on the electrode which establishes a diffuse layer of solvated cations.
28. Plot of ipc versus v1/2 and ipa versus v1/2 from voltammograms in Figure 27.
29. Cyclic voltammograms of 6, 8, 10 and 20 mM K3Fe(CN)6 in 0.1M KNO3 at 20 mV/s.
30. Plot of ipc versus concentration and ipa versus concentration for voltammograms in Figure 29.
31. Cyclic voltammograms of 4mM K3Fe(CN) in 1M Na2SO4 and 1M KNO3.
32. The mitochondrion.
33. Oxidative phosphorylation.
35. Cytochrome c. The heme is shown in red.
37. pH-dependent transitions. Thorell and Akesson showed that horse ferricytochrome c has 5 pH- dependent conformational states and ferrocytochrome c has three as proposed on the basis of spectrophotometric measurements.
38. pH-dependent transitions. Additional states of ferricytochrome c were reported by Myer et al. using resonance Raman spectroscopic measurements. Four states were confirmed electrochemically by Ikeshoji et al.
39. pH-dependent equilibrium of two functionally distinct forms of ferricytochrome c at alkaline pH.
40. Conformational Equilibrium. The pH-linked alkaline conformational change for ferrocytochrome c and the reoxidation of the alkaline form of ferrocytochrome c is suggested.
41. The Sodium-Potassium Pump located in the plasma membranes of cells.
42. The Band Model for Semiconductors. The following energy levels
are shown:
Ec - the conduction band edge
Ep - the valence band edge
Eg - the band gap
Ef,int - Fermi energy level
Ed - electron donor in the n-type semiconductors
Ea - electron acceptor in the p-type semiconductors
43. Characteristic Structures of Biological Membranes.
(A) The Fluid-Mosaic Model showing the dominate phospholipid content.
(B) The Mitochrondrial Membrane where proteins are prominent.
44. Lipid-globular Protein Mosaic Model. An electrical double-layer is created in aqueous solution as a result of the protruding ionic regions of proteins. The behavior of charged species near the membrane surface is analogous to the Helmholtz region at the electrode/aqueous electrolyte interface.
45. Factors which Affect The Stability Of A Redox Protein. include interaction of the metal ions with coordination ligands; dipoles surrounding and within the protein; buried charges; surface charges; ions in solution; and ligands which bind to the protein.
46.Formal Reduction Potentials Of The Participants In The Oxidative Phosphorylation Chain.
47. The value of E exhibited by an individual redox couple is a reflection of the relative stability of the reduced and oxidized states.
(a) Any factor which acts to stabilize the oxidized form makes
the redox couple a better electron-donor and results in a more negative
redox potential.
(b) Conversely, any factor which acts to stabilize the reduced form makes
the couple a better electron-acceptor and gives rise to a more positive
redox potential.
49. The electrode-protein complex for the idealized limiting case of a planar surface for a typical cyclic voltammogram of horse heart cytochrome c at a gold electrode, modified by adsorption of 4,4’-bipyridyl disulfide.
50. Binding of a ligand molecule to myoglobin. A possible reaction path is indicated by the dashed line.
52. The Electrochemical Cell Especially Designed For Temperature Studies.
![]()
53. Cyclic Voltammograms of 1 M K3Fe(CN)6 in 0.1 M KNO3 at 200 mV/s from 5-55C.
![]()
55. Cyclic voltammograms of cytochrome c in pH 8.0 Tris/cacodylic acid buffer at a scan rate of 1.03 V/s at temperature including 5, 15, 25, 35, 45, 55, 65C.3
![]()
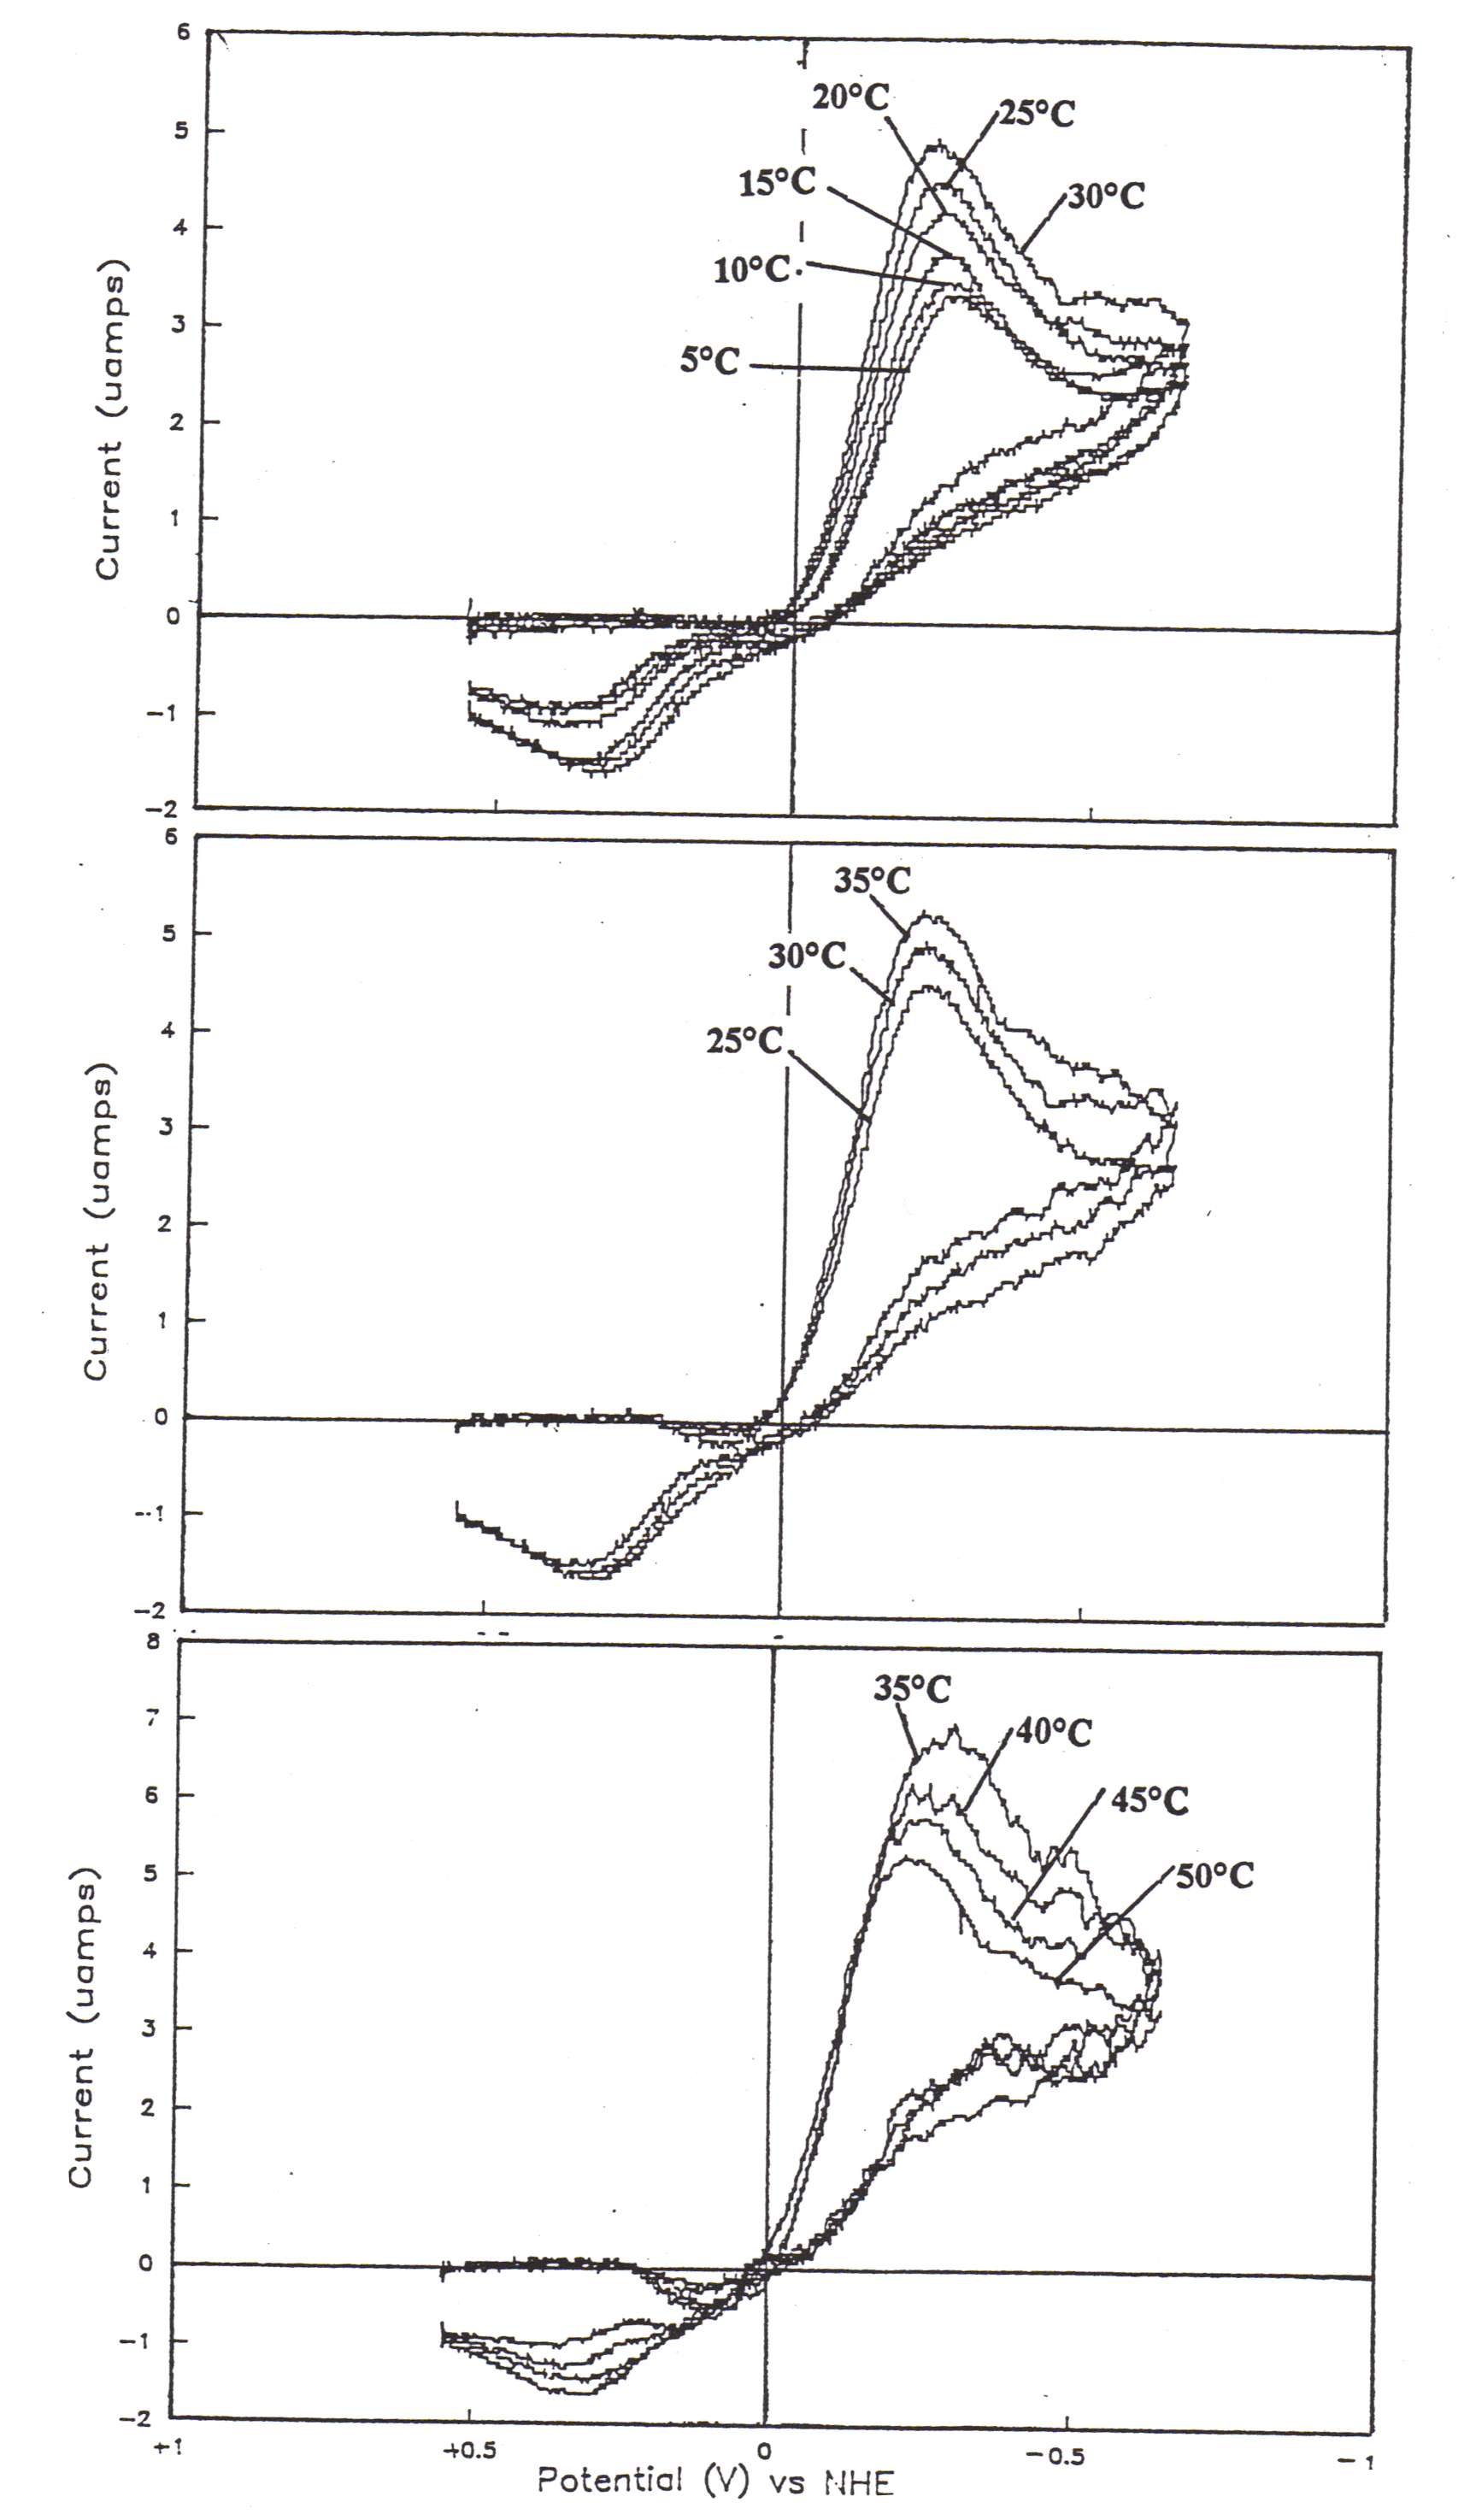
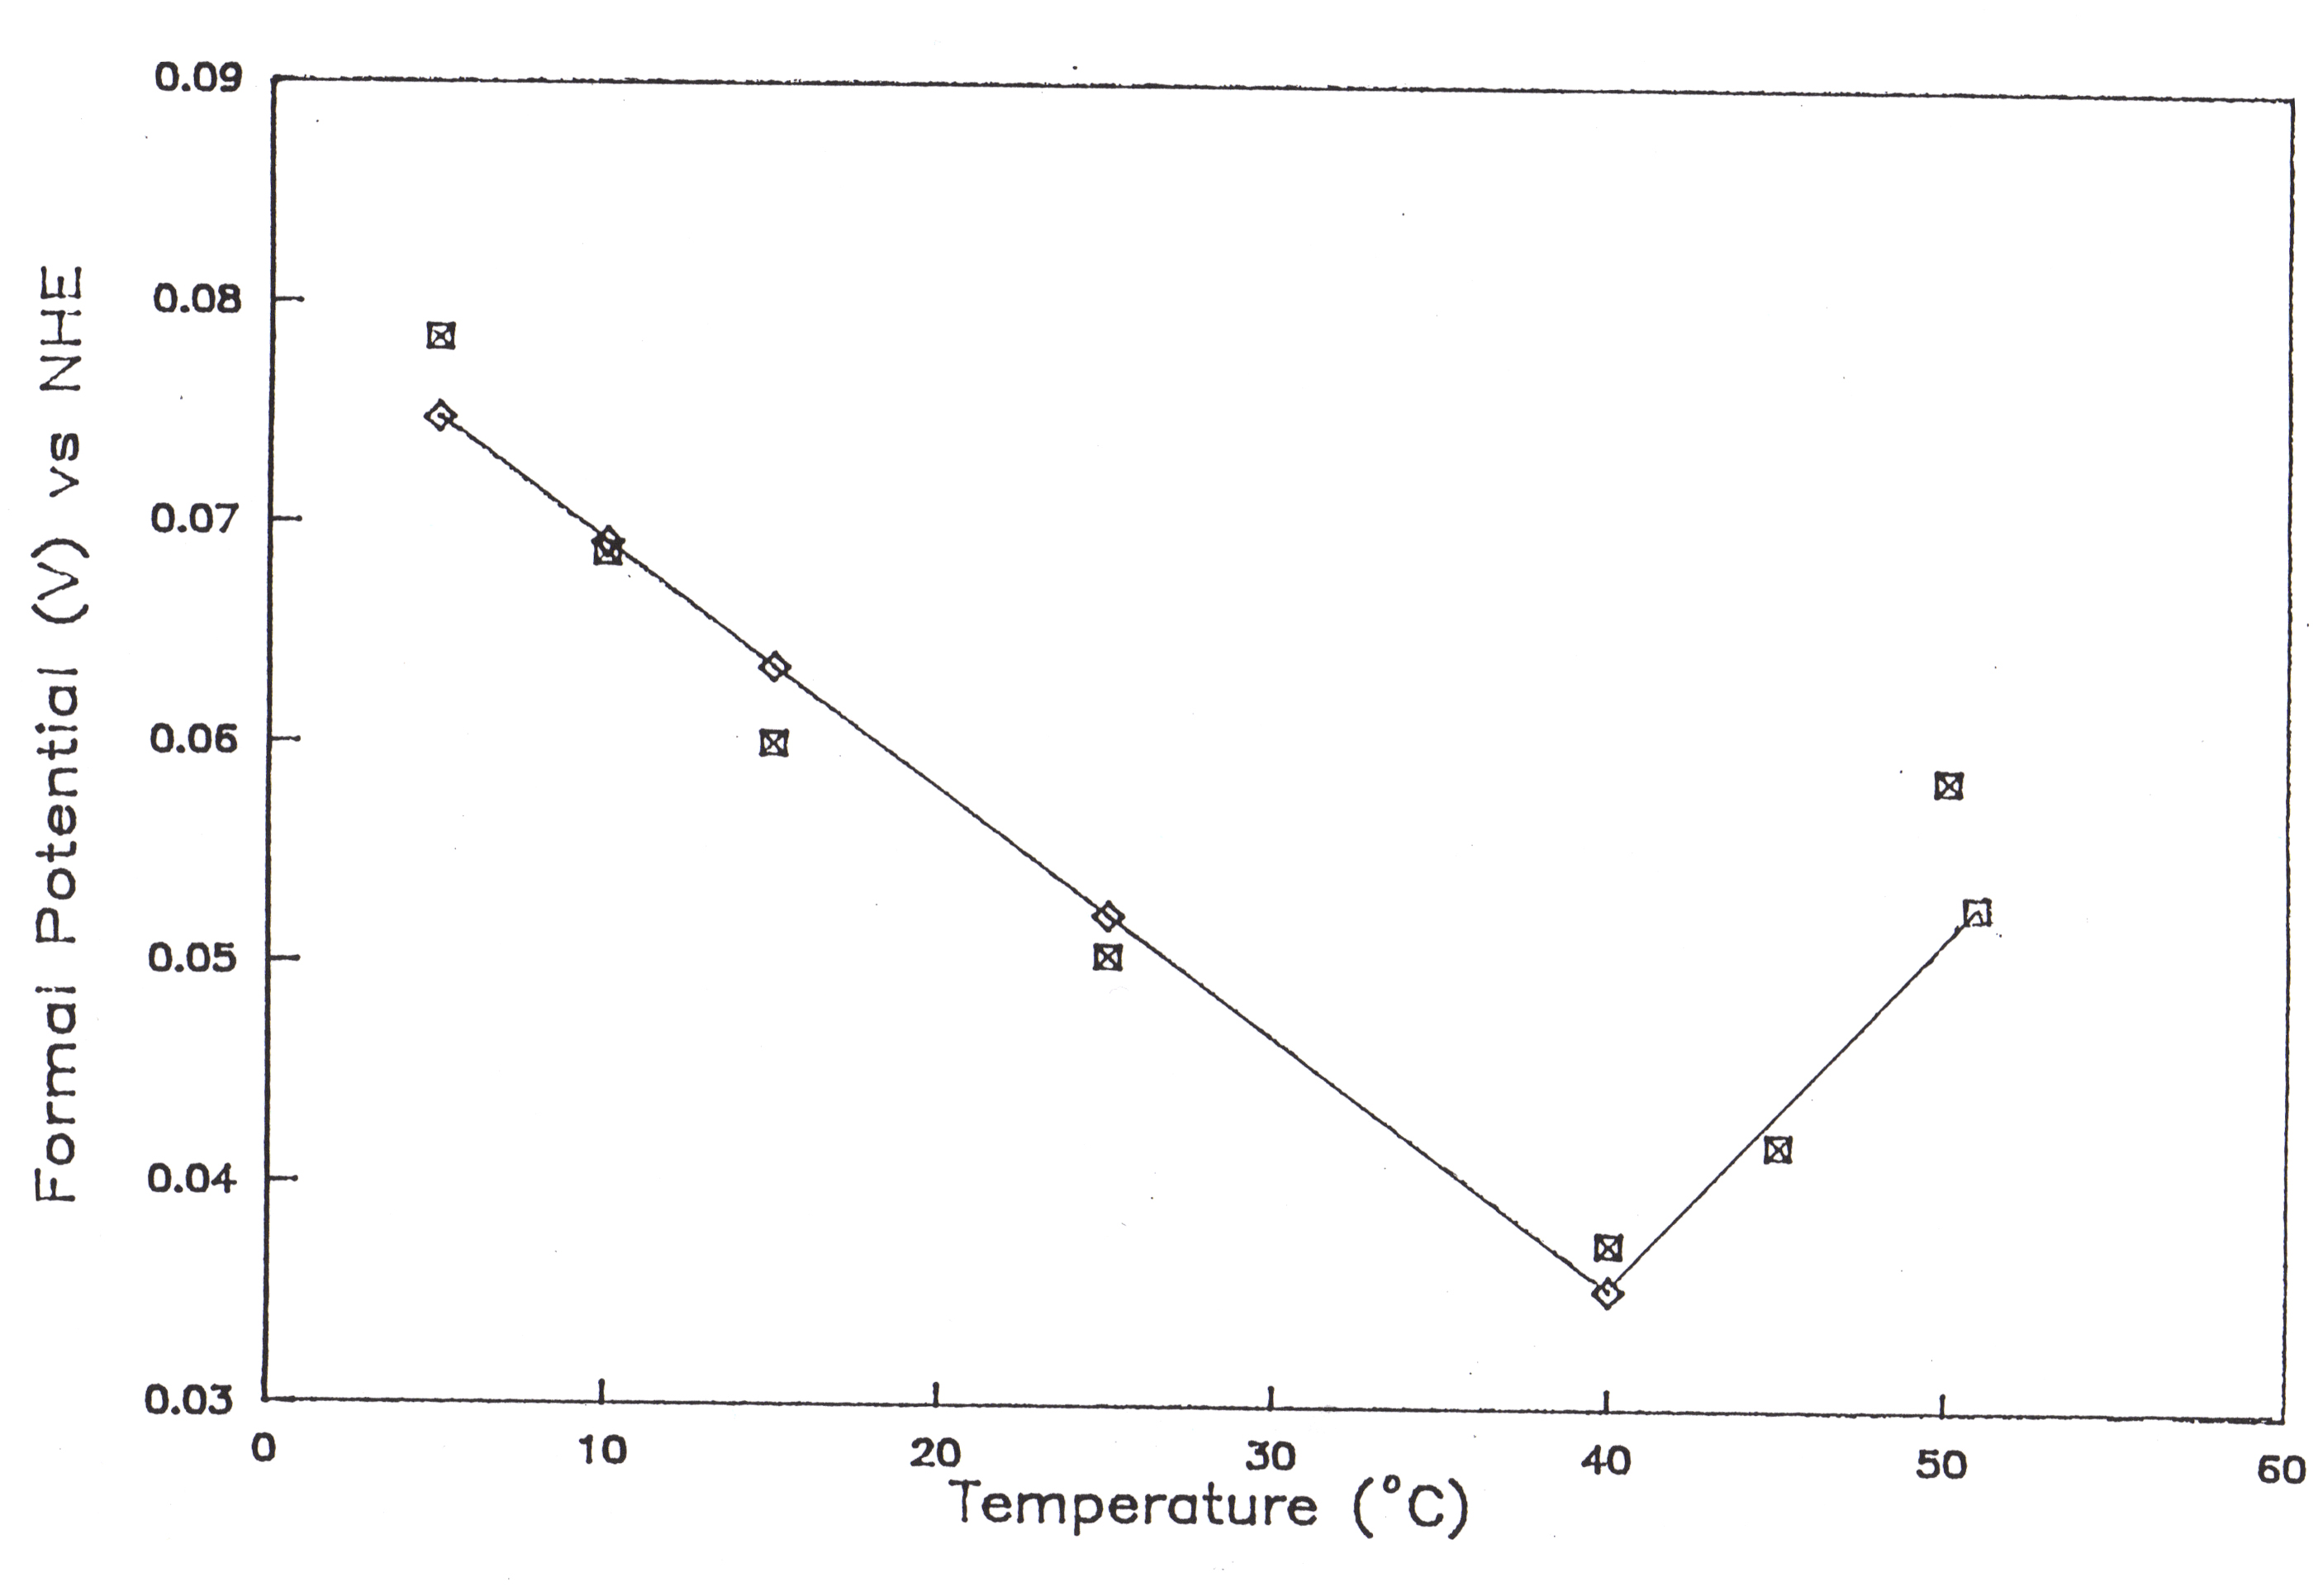
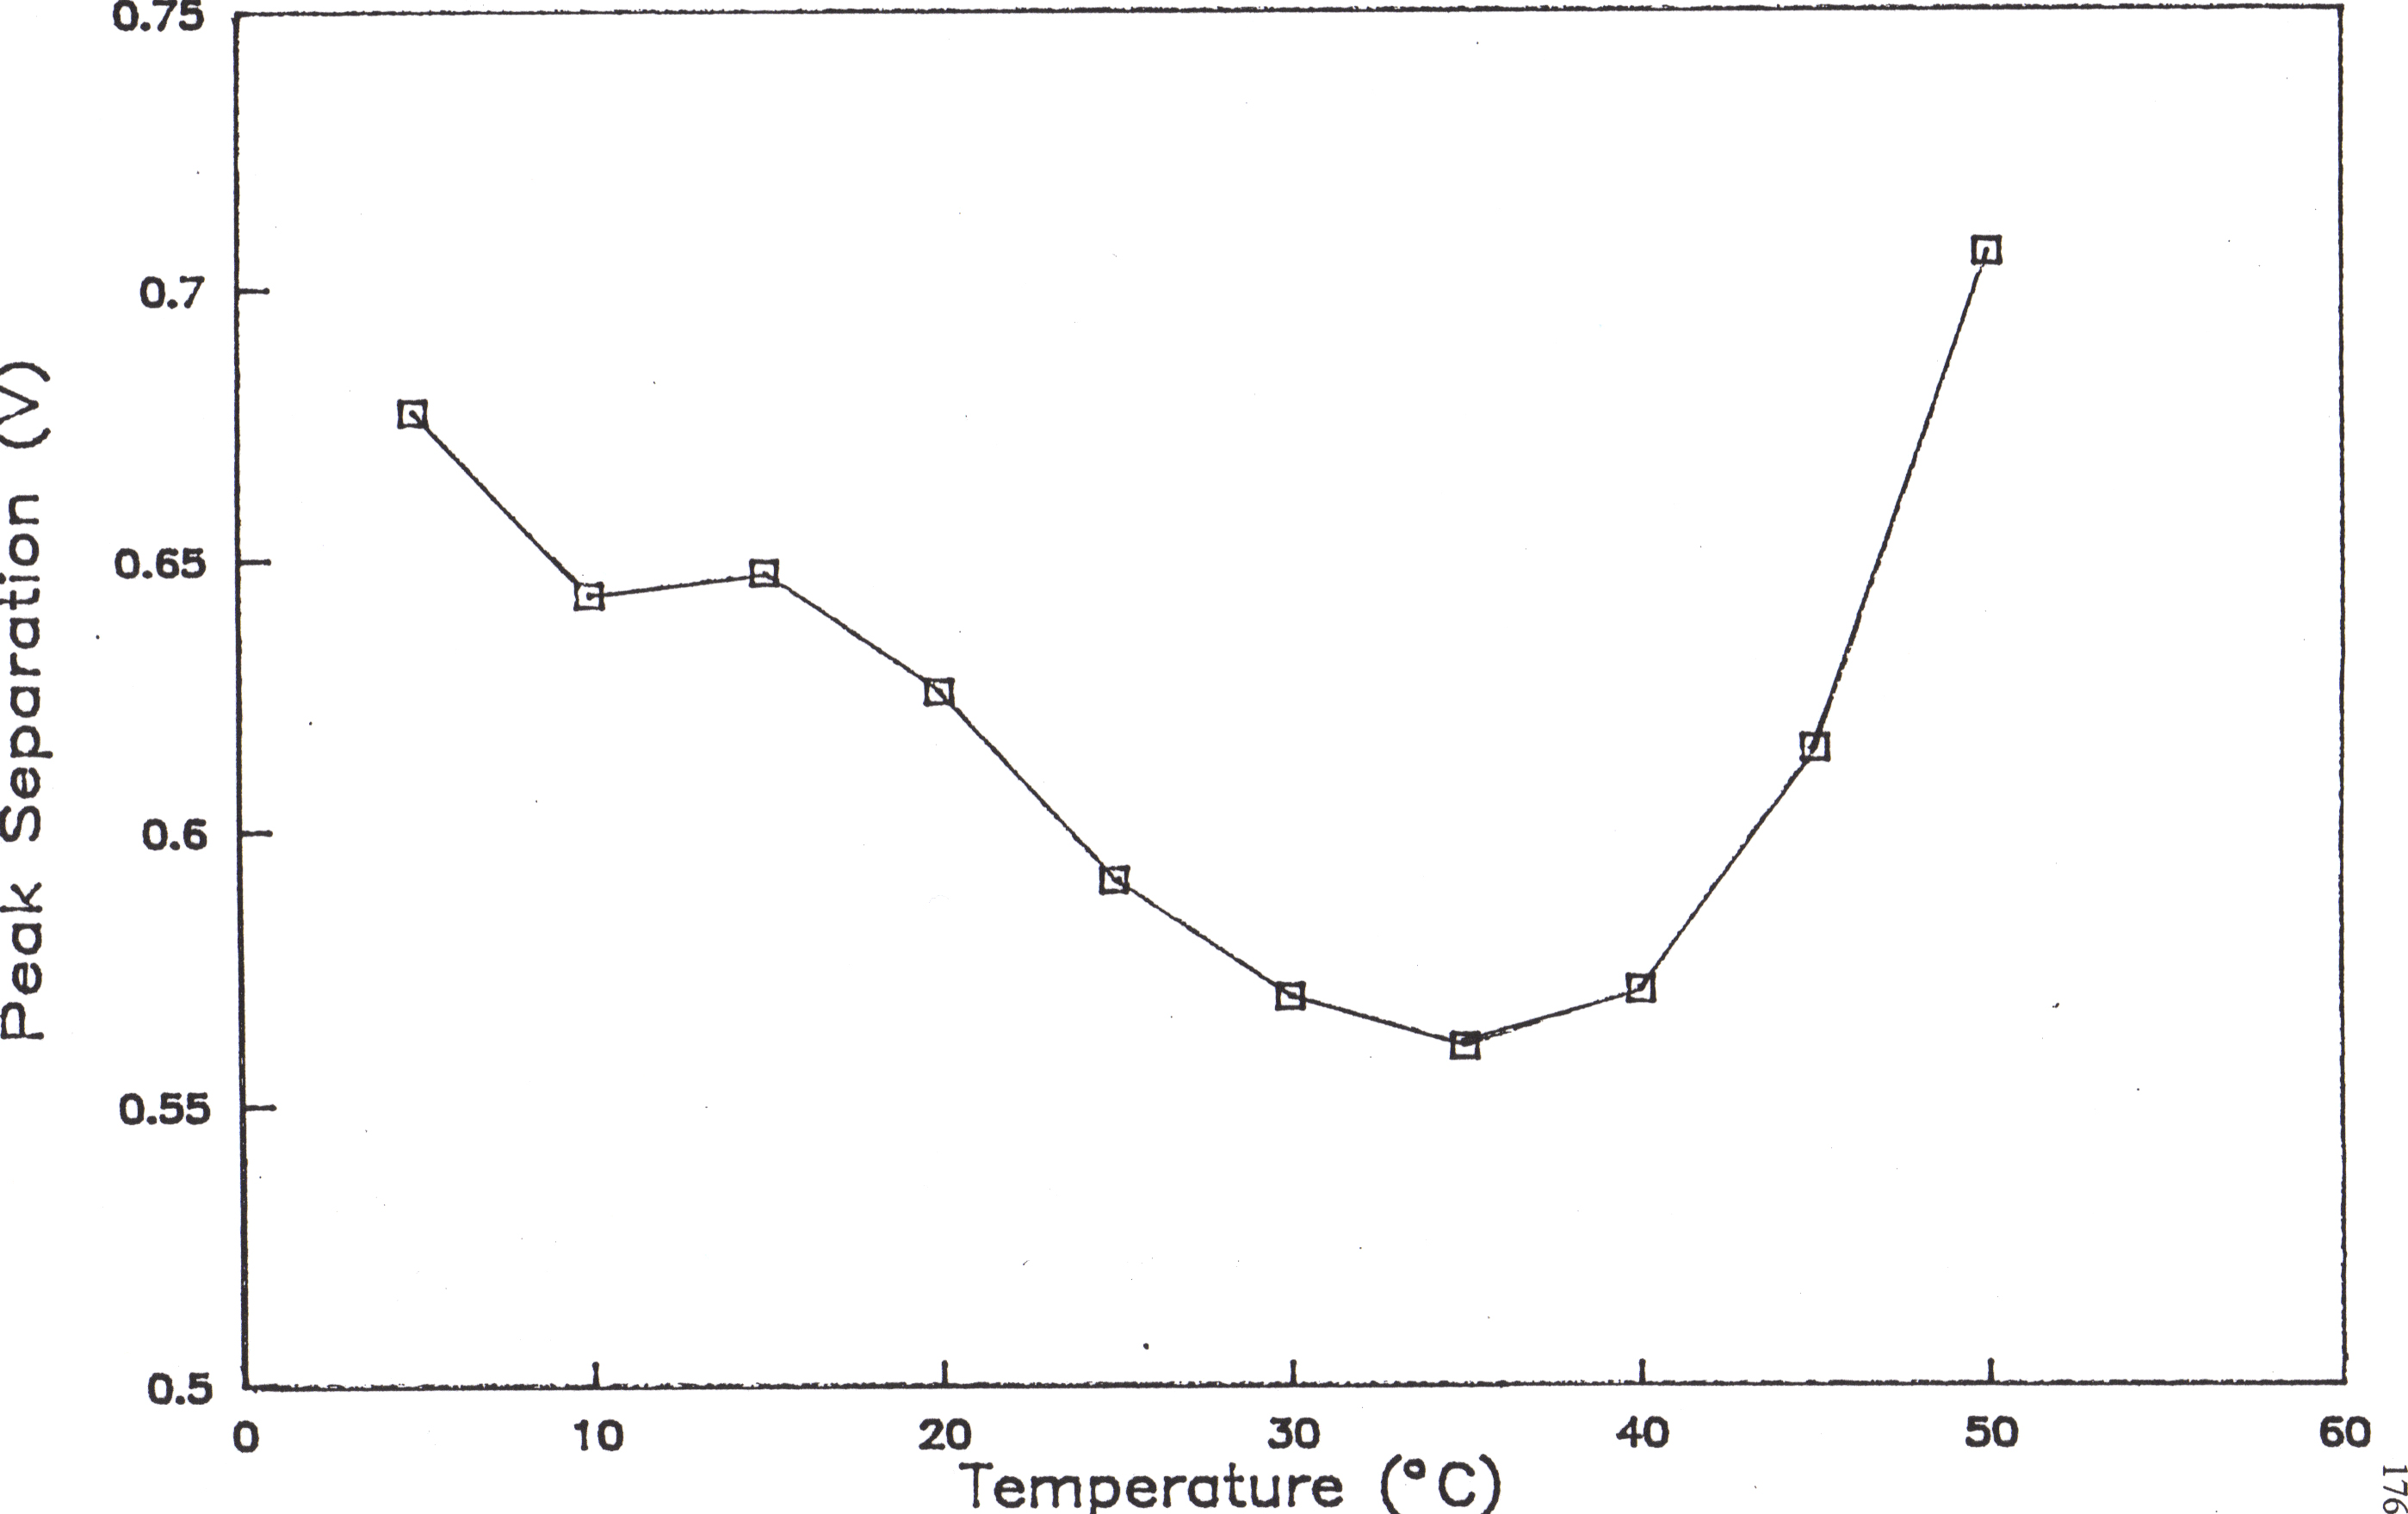
57. The temperature dependence of quasi-reversible cyclic voltammograms of 115 uM myoglobin at 20 mV/s.
57a.
![]()
57b.
![]()
57c.
![]()
61.The effect of pH on peak separation of cyclic voltammograms of myoglobin. l denotes sperm whale myoglobin. m denotes horse heart myoglobin.
![]()
62. The variation of peak potential separation (D Ep) with the kinetic parameter y .
![]()
![]()
64. The effect of pH on the formal heterogeneous electron transfer rate constant of myoglobin.
65. The best family of pathways between HIS 81 and the porphyrin in myoglobin.
![]()
![]()