CHAPTER 6
TEMPERATURE STUDIES
6.1 Electrochemical Cell
The cell (Figure 52) is held together by a metal retainer plate that clamps down on the top and bottom of the cell. The reference electrode is at room temperature. The rest of the cell’s temperature is dependent on water temperature. The surface area of the electrode corresponds to the area of the hole in the teflon tape. The teflon tape serves to hold the brass shim in place and to protect the brass shim from coming in contact with the solution of interest. The O-ring facilitates the formation of a seal between the cell and the working electrode. The reference and auxiliary electrodes are placed in close proximity to the working electrode to help eliminate IR drop. The solution volume in the cell is approximately 1 mL. Pretreatment and cleaning of the electrochemical cell involved soaking in a KOH bath overnight and then successive ultrasonications in Alconox (10 minutes), ethanol (5 minutes), and distilled water (5 minutes, twice).
6.2 Ferricyanide
A three-electrode potentiostat with a non-isothermal Lucite electrochemical cell of conventional design was used for all experiments with provision for nitrogen bubbling through a solution volume of approximately 1 mL. The working electrode was a tin-doped indium oxide film deposited on glass (Donnelly Corporation; Holland, MI.). A new electrode was used for each set of determinations. Prior to use, each working electrode was sonicated consecutively in Alconox (10 minutes), ethanol (10 minutes), and distilled water (5 minutes, twice). The area of the electrode was approximately 0.3cm1 in all experiments. A Ag/AgCl reference electrode in 1M KCL and a platinum auxiliary electrode completed the cell. The reference electrode was calibrated against saturated qunihydrone in the appropriate buffer before each experiment. A Haake D1 temperature controller was used to control the temperature of the electrochemical cell.
All determinations were carried out under nitrogen (Grade 4.5 from Airco, Inc.). The buffer and sample solutions were purged with nitrogen for at least 10 minutes prior to the beginning of a series of determinations. These experiments were performed after the temperature of the sample was increased in 5° C increments up to 50° C. All chemicals were ACS reagent grade and used as received. All water used was purified with a Milli RO-4/Milli-Q system (Millipore Corp.) and on delivery exhibited a resistivity of 18 MW .
A UNC microcomputer2 interfaced to 20us conversion time, 12 bit, fast Datel ADC-HX12B analog/digital converter was used in all experiments. The electrochemical instrumentation included a potentiostat of conventional design. The computer triggered the triangle waveform used in cyclic voltammetry experiments. Cyclic voltammetric data were acquired at a rate of 1 point per 0.8 mV. All scans were initiated in a negative direction. The initial potential was set at 0.8 V and the scan limits at 0.8 V and -0.12 V. Background scans of the buffers were obtained prior to each experiment, and cyclic voltammograms were digitally background subtracted. DT/Notebook, from Data Translation, 100 Locke Drive, Marlborough, MA 01752 was used to generate and analyze the data.
Figure 53 shows the cyclic voltammograms of 1M K3Fe(CN)6 in 0.1 M KNO3 at 200 mV/s from 5-55°C. Figure 54 is a graph of the linear dependence of the formal reduction potential(V) vs NHE as a function of temperature. The reaction center entrophy change, D S°rc, reflects the magnitude and sign of conformational changes that occur as a function of temperature2 and can be written as:
D S° rc = Sred°- Sox° = nF(dE° ‘ /dT)
From the slope of the line of the formal potential with respect to temperature, the reaction center entropy was calculated to be -36.90 eu. In further studies (five experiments) conducted at 20 mV/s, the reaction center entropy for temperature studies of ferricyanide averaged to be -33.11 eu.
6.3 Cytochrome C
Koller et al. investigated the effects of temperature and electrolyte at acidic and alkaline pH on the electron transfer reactions of cytochrome c at In2O3 electrodes.3 Figure 55 shows the temperature dependence of quasi-reversible cyclic voltammograms of cytochrome c in pH 8.0 Tris/cacodylic acid buffer at a scan rate of 1.03 V/s at temperatures including 5, 15, 25, 35, 45, 55, 65°C. Noteworthy is the temperature dependence of the asymmetry of the peak potentials about the formal potential and the point of maximum current which simultaneously changes at approximately 40°C. Furthermore, the temperature dependence of the formal potential breaks at 40°C as well.
Ikeshoji et al. characterized electrochemically distinguishable states of ferricytochrome c and their transition with changes in temperature and pH.4 The very sharp, biphasic behavior of the formal potentials of cytochrome c as a function of temperature and pH is displayed in Figure 56. A conformational transition in ferricytochrome c instead of a change by an equilibrium reaction accounted for the observed sharp biphasic changes of the formal potential with pH and temperature. Thermally induced conformational changes are associated with denaturation processes and can uncover insights into important structural and functional features of the protein.5
6.4 Myoglobin
Lyophilized myoglobin from horse skeletal muscle (Sigma) was dissolved in 0.2 M Tris/cacodylic acid buffer pH 7.0. The myoglobin solution was filtered through a YM30 filter (Amicon) to remove high molecular weight species, shown to be present by gel electrophoresis, which interfered with electron transfer.6,7 The cacodylic acid (hydroxydi-methylarsine oxide, 98% pure from Sigma) was twice recyrstallized from 2-propanol. All other chemicals were ACS reagent grade and used as received. These included tris(hydroxymethyl) aminomethane (Trizma Base, reagent grade, Sigma) tris(hydroxymethyl) aminomethane (Trizma Base, reagent grade, Sigma), and tris(hydroxymethyl) aminomethane hydrochloride (Aldrich). All water used was purified with a Milli RO-4/Milli-Q system (Millipore Corp.) and on delivery exhibited a resistivity of 18 MW .
Myoglobin concentrations were determined spectrophotometrically from the absorbance difference of the ferro- and ferrimyoglobin at 434 nm using a Hewlett-Packard HP8452A diode array spectrophotometer interfaced to an IBM PC AT computer. Spectral plots were made with a Hewlett-Packard (HP 7470A) graphics plotter. The difference molar absorptivity of myoglobin at this wavelength is 96, 700 M-1cm-1. After the spectrum for the oxidized species was obtained, the ferrimyoglobin was reduced with sodium dithionite.8
A three-electrode potentiostat with a non-isothermal Lucite electrochemical cell of conventional design was used for all experiments with provision for nitrogen bubbling through a solution volume of approximately 1 mL. The working electrode was a tin-doped indium oxide film deposited on glass (Donnelly Corporation.). A new electrode was used for each set of determinations. Prior to use, each working electrode was sonicated consecutively in Alconox (10 minutes), ethanol (10 minutes), and distilled water (5 minutes, twice). The area of the electrode was approximately 0.3cm1 in all experiments. A Ag/AgCl reference electrode in 1M KCL and a platinum auxiliary electrode completed the cell. The reference electrode was calibrated against saturated qunihydrone in the appropriate buffer before each experiment. A Haake D1 temperature controller was used to control the temperature of the electrochemical cell.
All determinations were carried out under nitrogen (Grade 4.5 from Airco, Inc.). The buffer and sample solutions were purged with nitrogen for at least 30 minutes prior to the beginning of a series of determinations. Myoglobin solutions must be nitrogen purged longer than pure buffers to remove dioxygen. These experiments were performed after the temperature of the sample was increased in 5° C increments up to 50° C.
A UNC microcomputer2 interfaced to 20us conversion time, 12 bit, fast Datel ADC-HX12B analog/digital converter was used in all experiments. The electrochemical instrumentation included a potentiostat of conventional design. The computer triggered the triangle waveform used in cyclic voltammetry experiments. Cyclic voltammetric data were acquired at a rate of 1 point per 0.8 mV. All scans were initiated in a negative direction. The initial potential was set at +0.200 V and the scan limits at +0.200 V and -0.800 V. Background scans of the buffers were obtained prior to each experiment, and cyclic voltammograms were digitally background subtracted. DT/Notebook, from Data Translation, 100 Locke Drive, Marlborough, MA 01752 was used to generate and analyze the data.
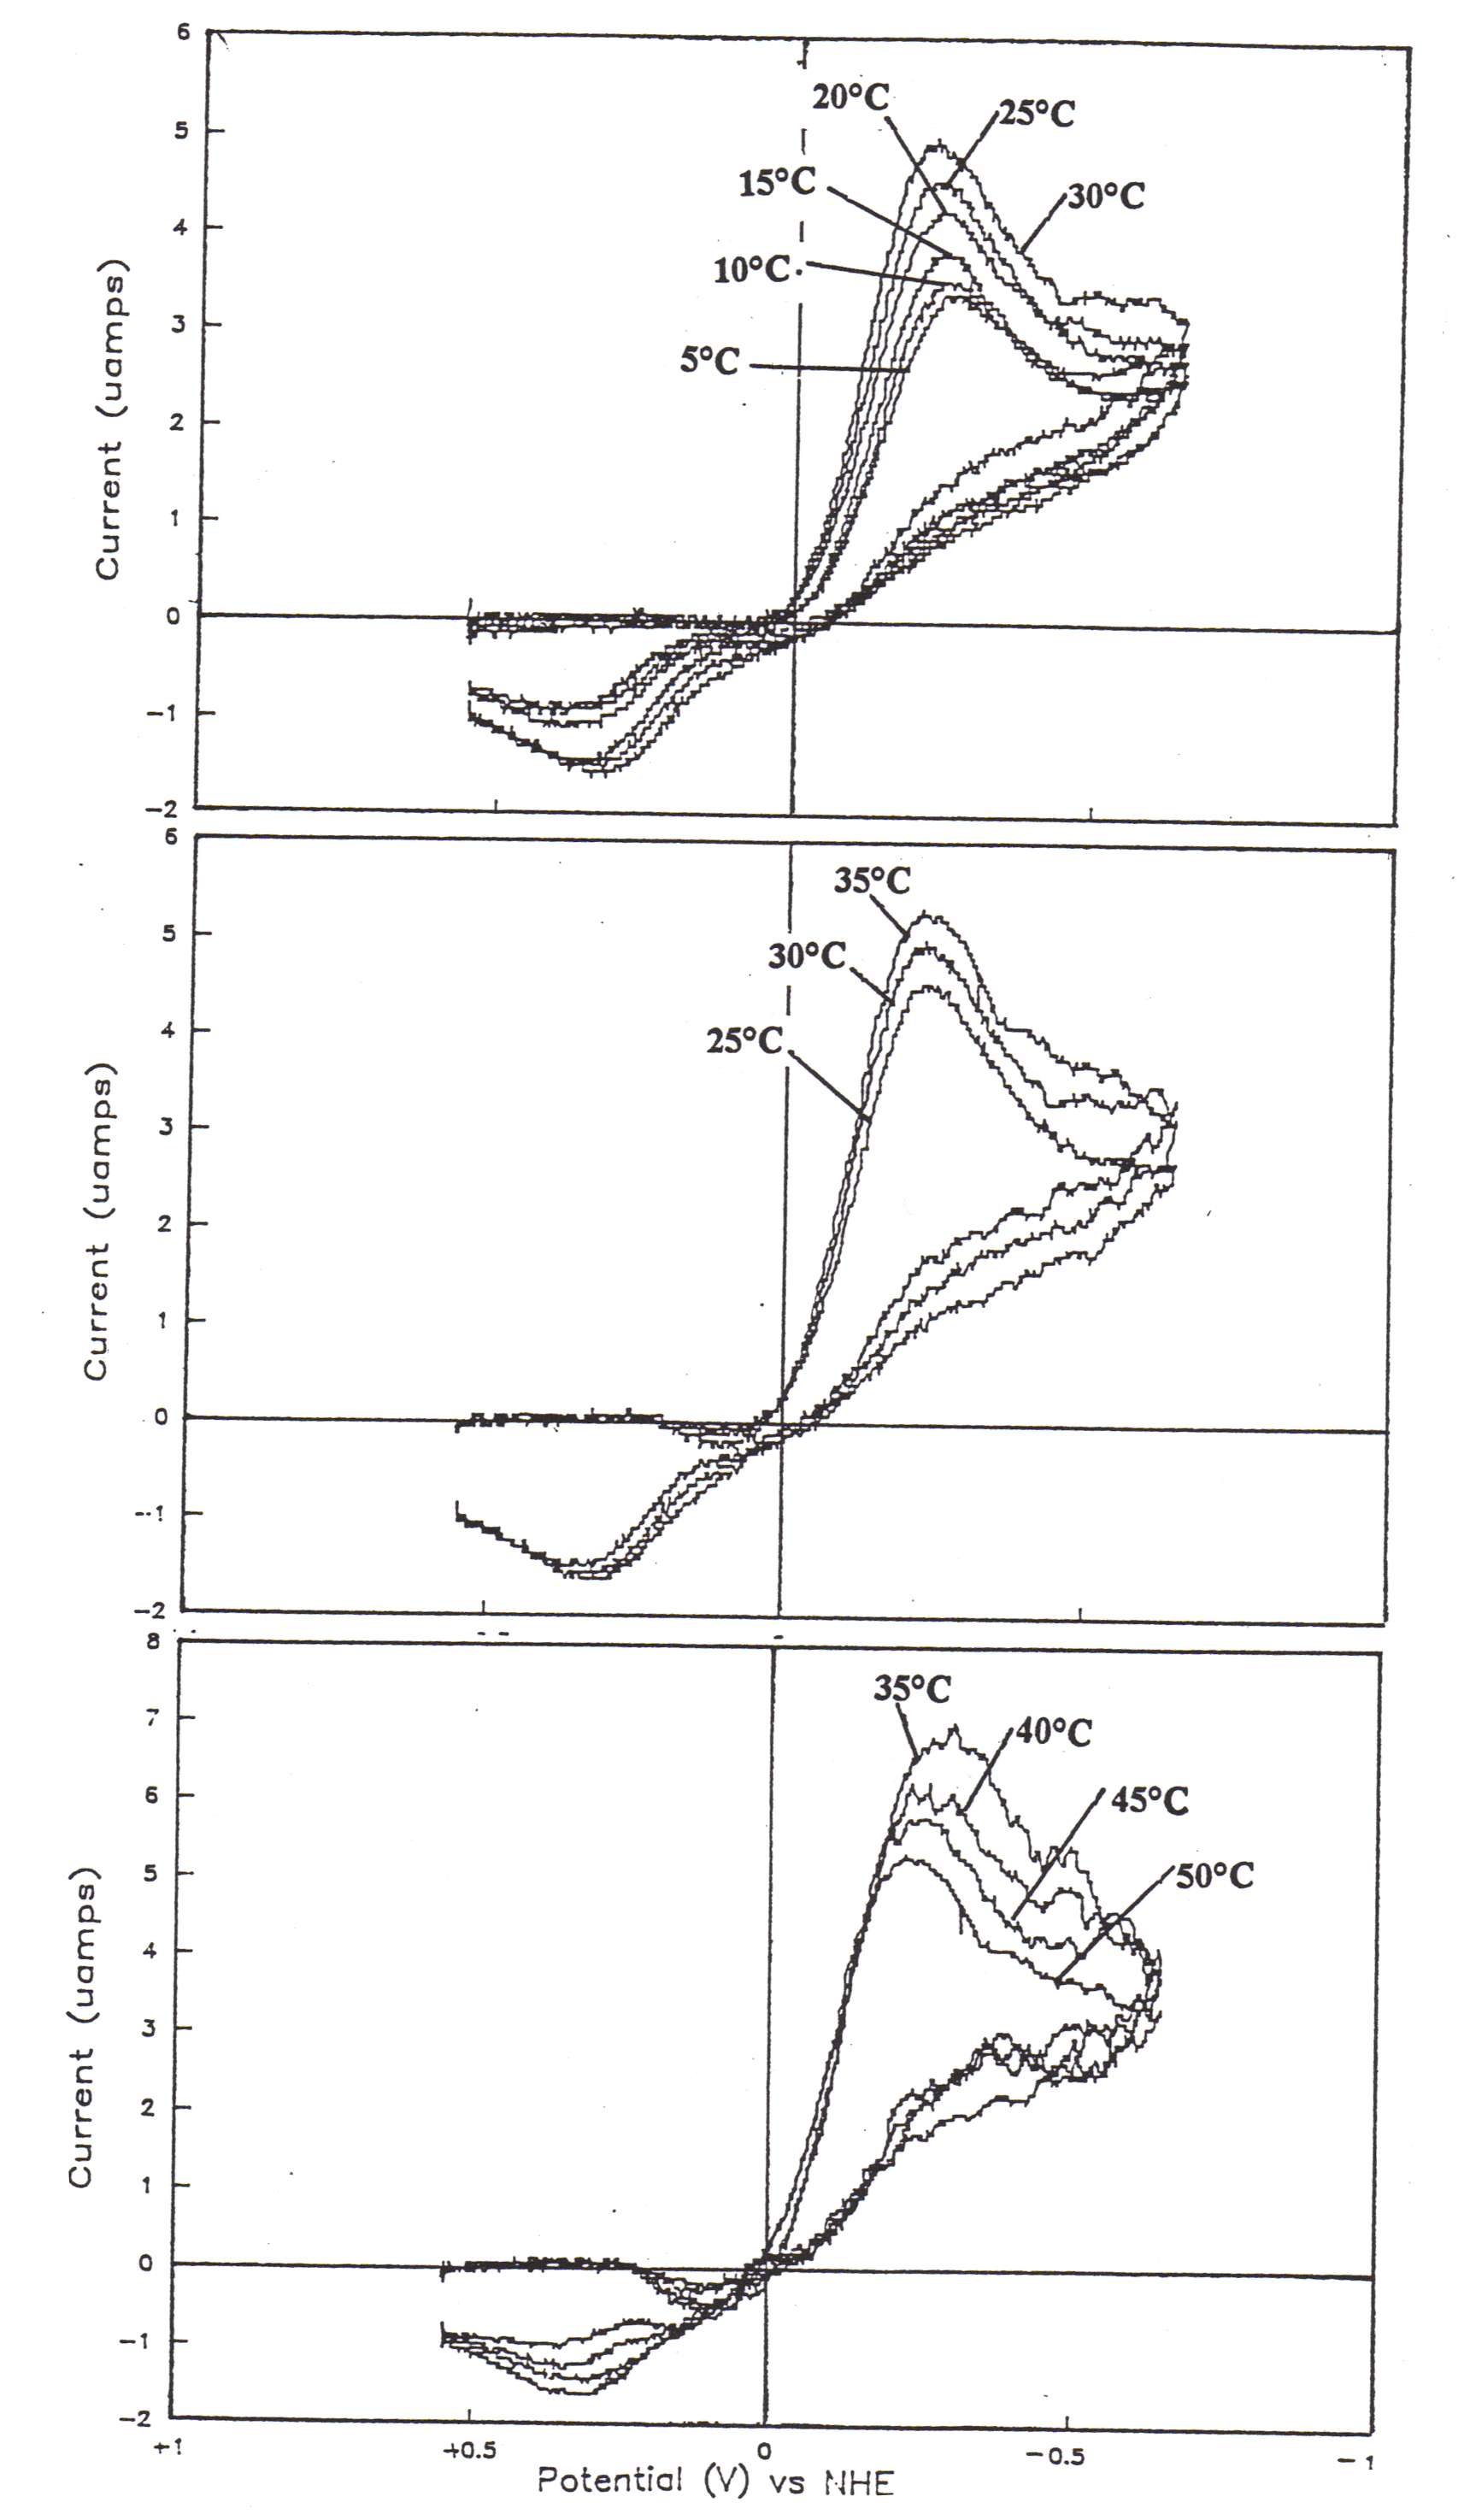
Figure 57 shows the temperature dependence of quasi-reversible cyclic voltammograms of 115.52 uM myoglobin in Tris/cacodylic buffer, pH 7.0, u = 0.20, at 20 mV/s. The electrochemical behavior of myoglobin follows a distinctive pattern with temperature. From 5° C to approximately 37° C (Figure57a) (Figure57b), both the cathodic and anodic peaks show trends of increasing current. Interestingly enough, from 37° C to 50° C (Figure 57c), the cathodic peaks continue to increase while the anodic peaks begin to decrease. Qualitatively, the temperature dependence of the peak currents is indicative of the diffusion coefficient which is related to mass transport. Do is the diffusion coefficient for the oxidation and can be determined from the anodic peak current, ipa. On the other hand, DR is the diffusion coefficient for the reduction and can be determined from the cathodic peak current, ipc. The diffusion coefficient for the reduction of myoglobin continues to increase from 5-50° C; however, the diffusion coefficient for the oxidation maximizes at approximately 37° C.
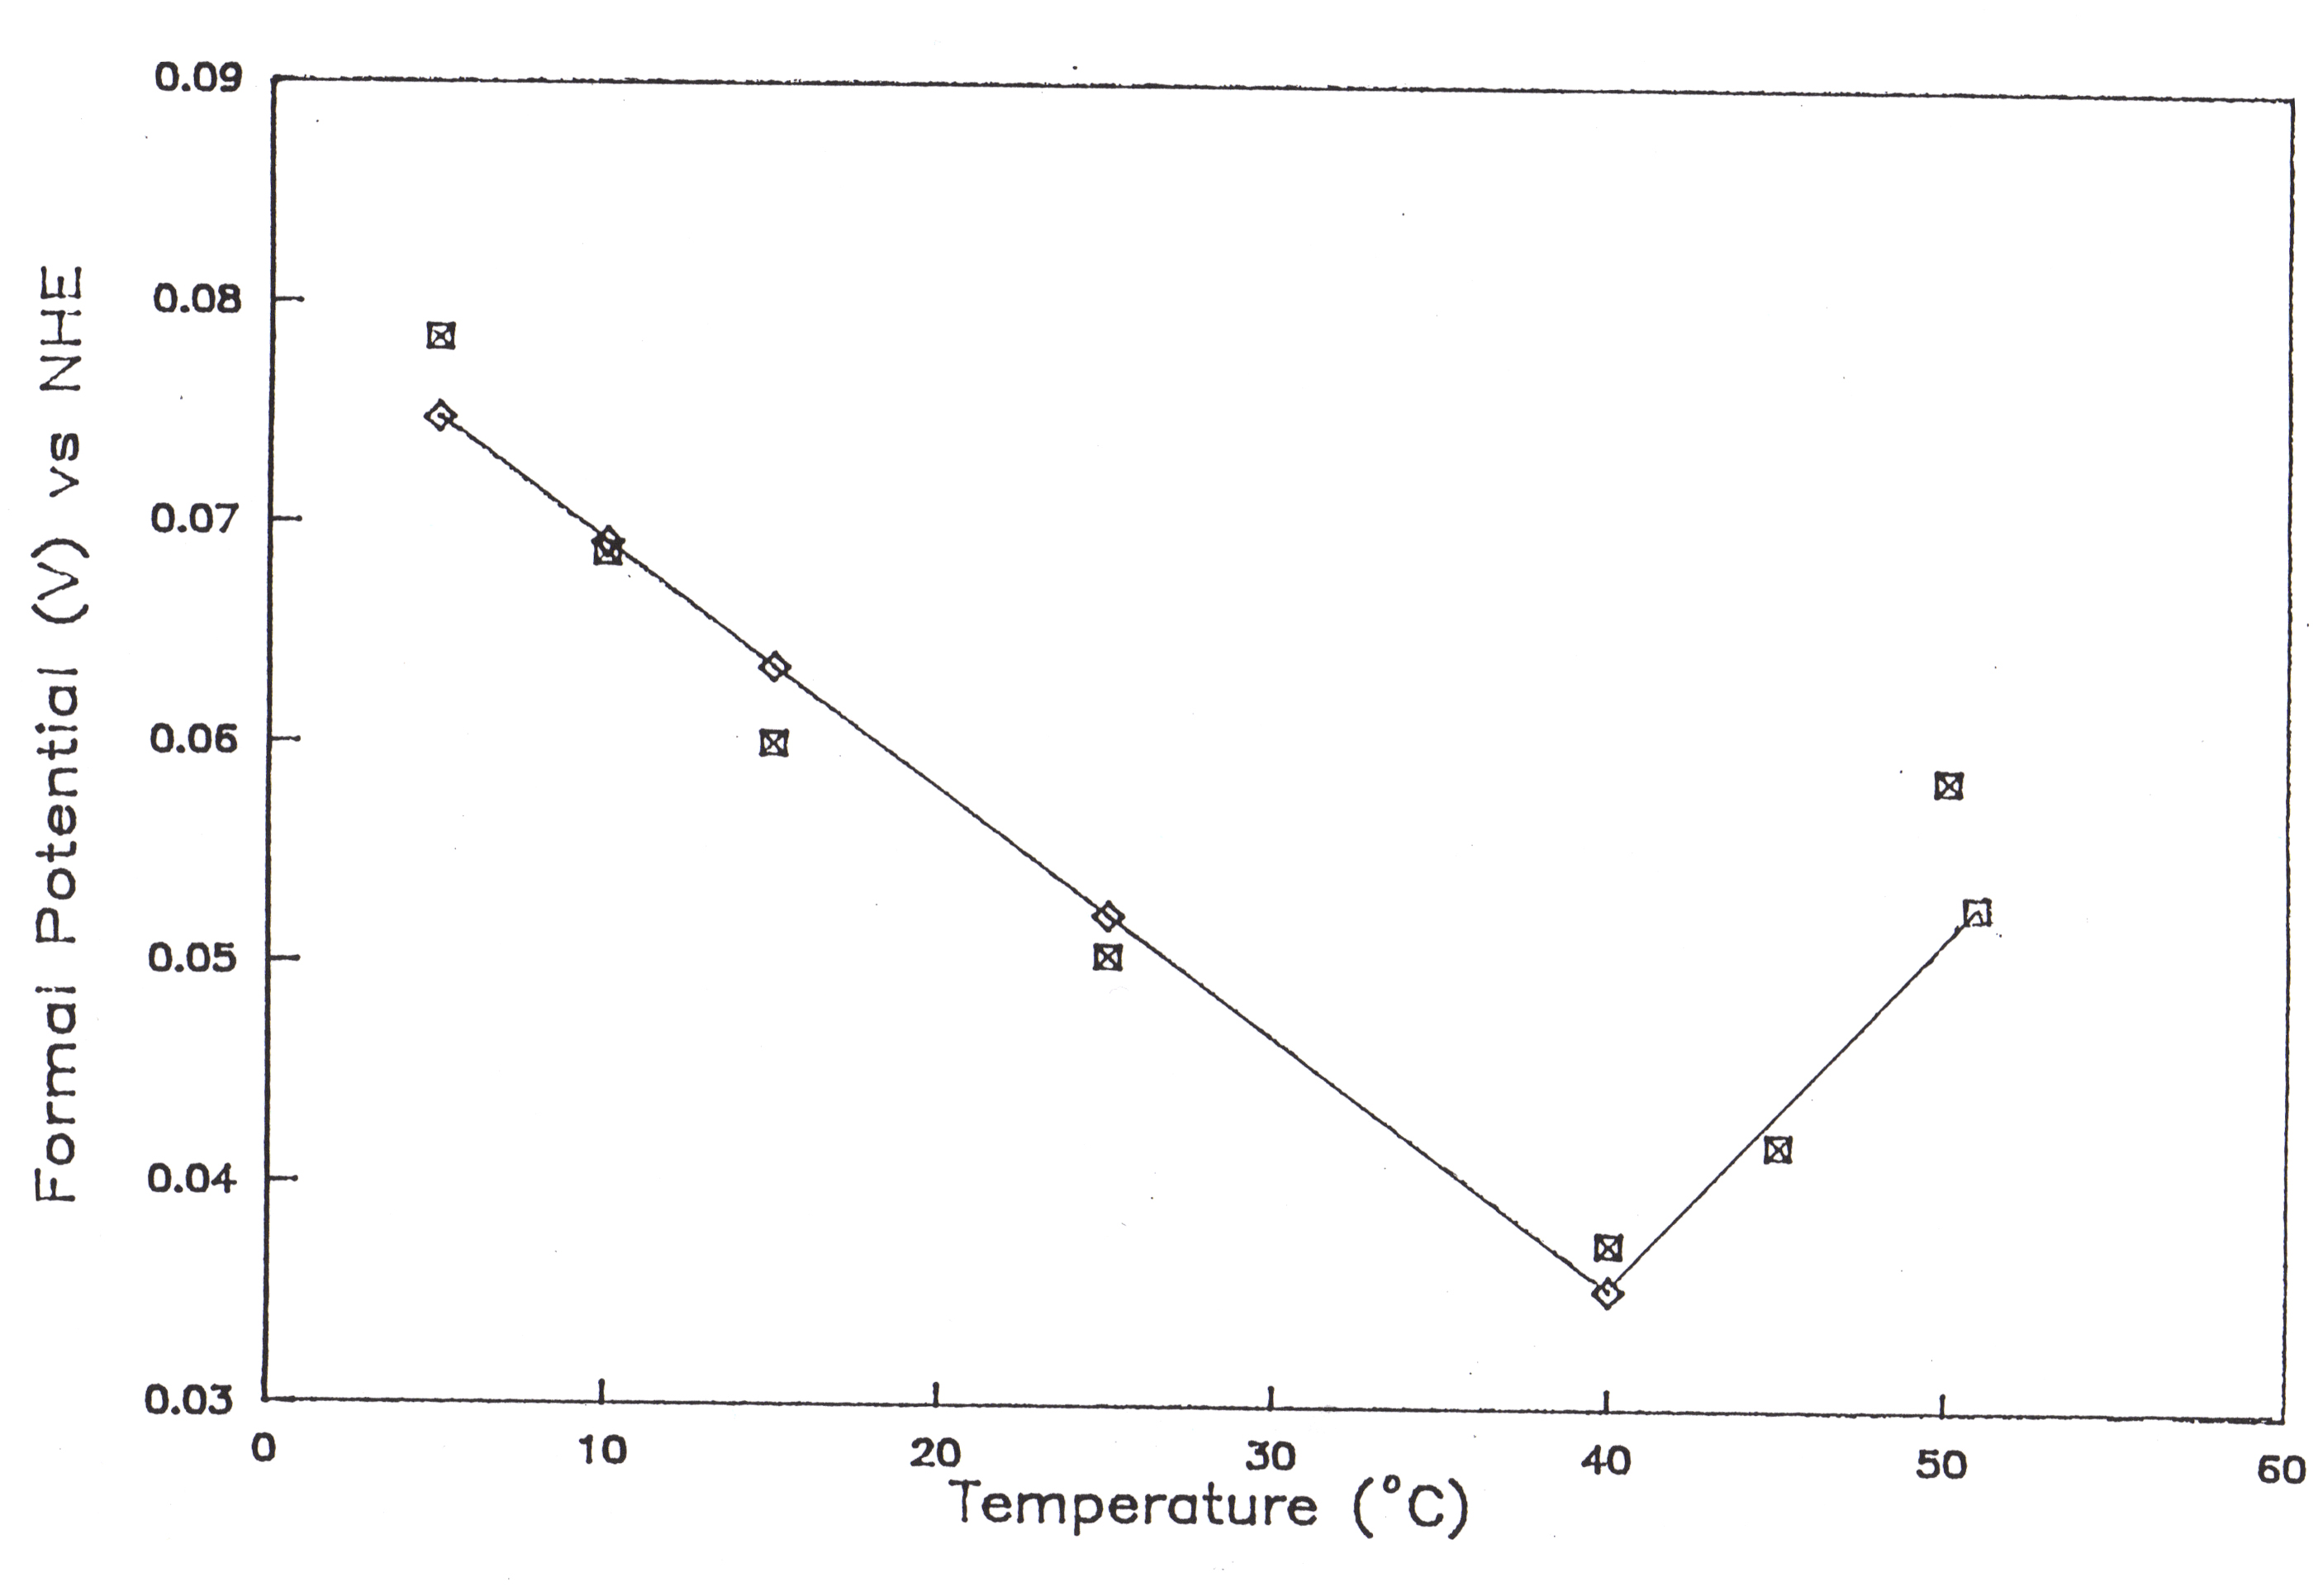
The temperature dependence of the formal potential is shown in Figure 58 for the cyclic voltammograms of myoglobin. Heineman et al. verified the formal potential of myoglobin, E° ‘ = 46.4 mV vs SHE and the number of electrons transferred n = 0.95.9 The formal potentials reported here approach the reported literature values at approximately 37° C. Furthermore, the reaction center entrophy, D Src, was -26.058 eu from 5-40° C, and +48.934 eu for 40-50° C. An abrupt change in the temperature dependence of the structural or functional parameters signals a change in the protein conformation.10 The radical reaction center entropy change for the heterogeneous electron reaction of myoglobin arises from the denaturation of myoglobin occurring at 37° C. From 5-37° C, the negative reaction center entropy can be attributed to structural fluctuations which occur within the protein. At 37° C, the non-spontaneous disruption of the heme is followed by the spontaneous complete unfolding and denaturation of the protein, thus the positive reaction center entropy trend from 40-50° C.
Figure 59 illustrates changes in D G as a function of the sign and magnitude of D S for an exothermic reaction (D H < 0, point A) or an endothermic reaction (D H > 0, point B).11 Point A corresponds to disordering of the surroundings while point B corresponds to ordering of the surroundings. When D S is negative, the system is ordered and when D S is positive the system is disordered. The temperature dependence of the formal potential of myoglobin uniquely follows line two and then abruptly follows line three at 37° C.
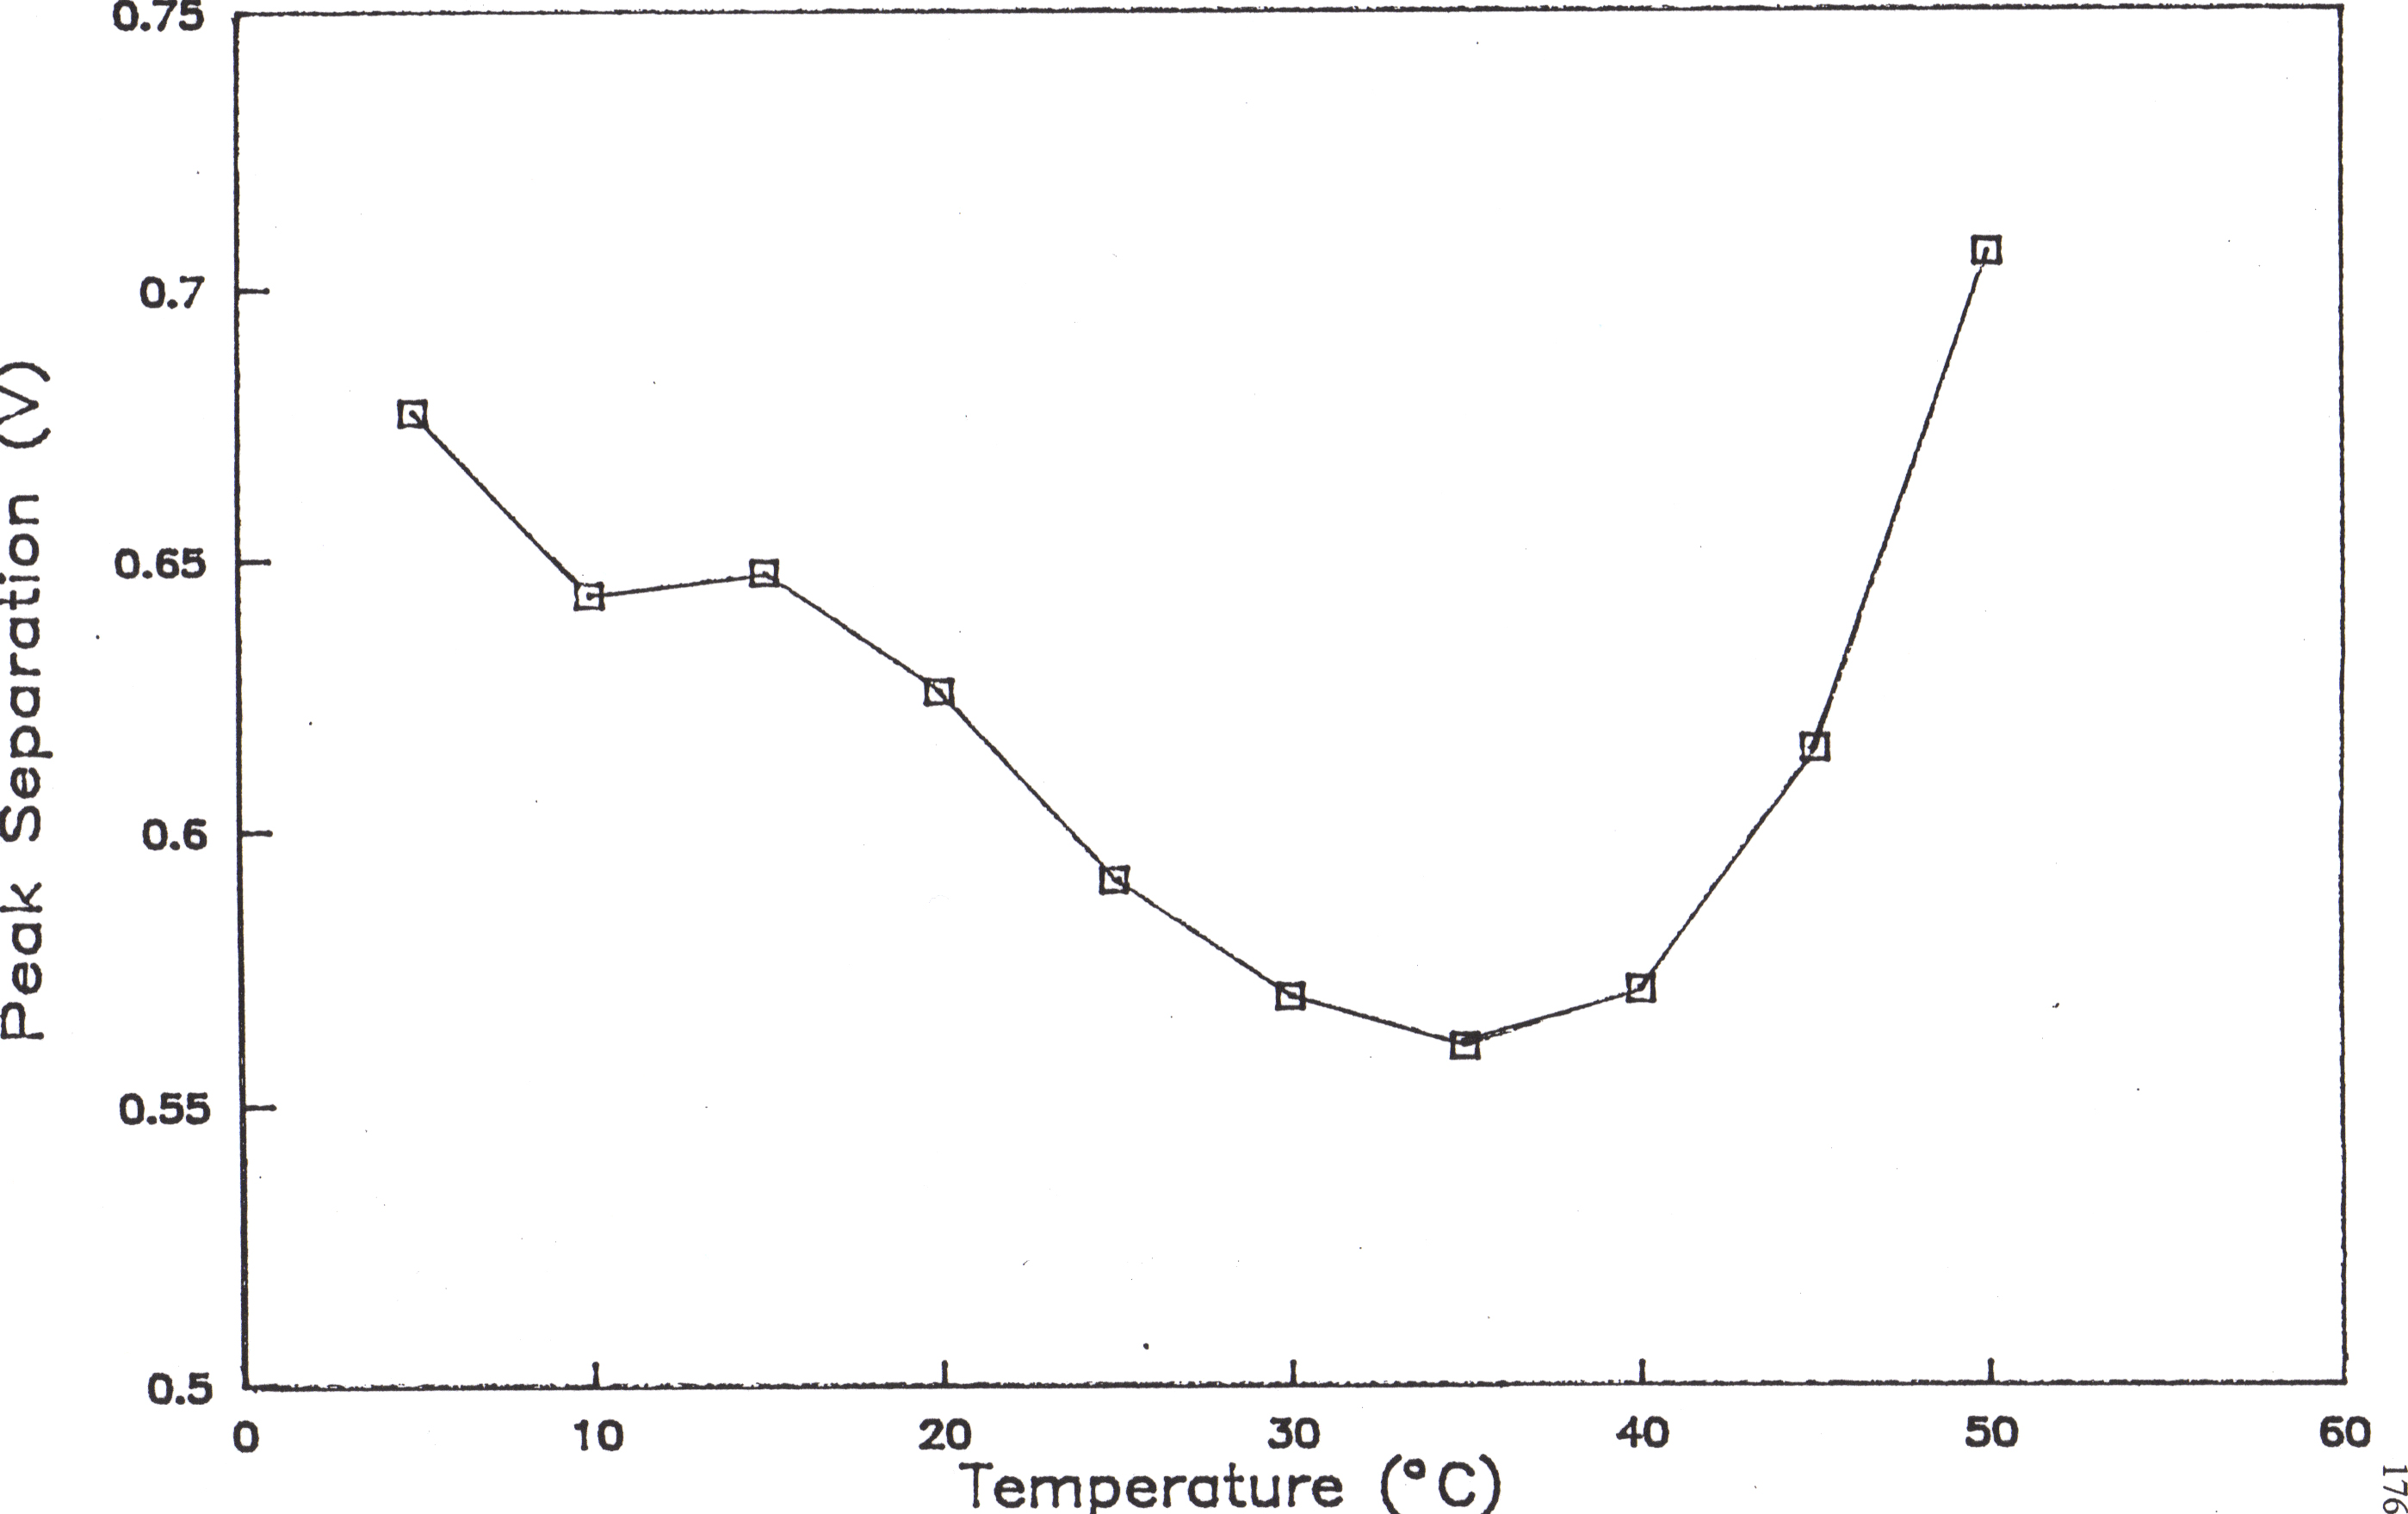
The variation in peak separation as a function of temperature is shown in Figure 60. From 5-37° C, the cyclic voltammograms show a gradual increase in the reversibility of the reaction as evidenced by the decrease in peak separation. From 37-50° C, the cyclic voltammograms display trends consistent with the gradual unfolding of myoglobin and switch to more irreversible reactions as the peak separation begins to increase. A similar trend was established when the effect of pH on peak separations of cyclic voltammagrams of myoglobin was determined by Masato Tomiga at Kumamoto University (Figure 61).12
Theoretical calculations published by Nicholson facilitate the use of of cyclic voltammetry to measure standard rate constants for electron transfer.13 Figure 62 is a plot of the variation of peak potential separation (D Ep) with the kinetic parameter y :

where Do = diffusion coefficient for the oxidation, cm2/s
DR = diffusion coefficient for the reduction, cm2/s
k° = the heterogeneous rate constant, cm/s
a = transfer coefficient, dimensionless
v = scan rate, V/s
n = the number of electrons
F = Faraday’s constant, 9.64846 X 10⁴ C/equiv
R = gas constant, 8.31441 J mol-1 K-1
T = temperature, K
For horse heart myoglobin D = 5.1 (+0.3) X 10-7 cm2/s,12 n = 0.95 and k° = 2.6 (+0.5) X 10-5 cm/s.8 Figure 63 reveals the temperature dependence of the rate constant of the heterogeneous electron transfer reaction of myoglobin; however, the method of the calculation should be considered when interpreting the results. The peak potential separations for the cyclic voltammograms of myoglobin are not within the limits as established by Nicholson,13 and extrapolation of the Nicholson plot (Figure 62) yielded negative kinetic parameters; therefore, in this calculation the kinetic parameter y was held constant at 0.1. The variation in peak separation as a function of temperature for the heterogeneous reaction of myoglobin (Figure 60) indicates qualitatively the temperature dependence of the rate constant of the heterogeneous electron transfer reaction of myoglobin would not have a strictly linear trend. Furthermore, Masasto Tominga determined the effect of pH on the formal heterogeneous electron transfer reaction of myoglobin (Figure 64) which clearly displays more than a linear relationship.
The temperature dependence for the rate constant of the heterogeneous electron transfer reaction of myoglobin would better be determined using single potential step chronoabsorptometry (SPS/CA).8 The monitoring of absorbance, rather than current or charge as the potential is varied, allows species selectivity in biological solutions containing unknown impurities. From SPC/CA experiments, absorbance is monitored as a function of time for various overpotentials, h . The normalized absorbance is plotted on working curves to obtain values for log kf,h (D/t)1/2. The average log kf,h value is obtained for each overpotential. From a plot of log kf,h versus overpotential, the heterogeneous rate constant k° f,h and the electrochemical transfer coefficient, a , can be calculated.
6.5 References
1. Sun, S.; Reed, D.E.; Hawkridge, F.M. Redox Chemistry and Interfacial Behavior of Biological Molecules. (G. Dryhurst and K. Niki Eds.) New York: Plenum Publishing Corporation, 1988.
2. Woodard, F.E.; Woodward, W.S.; Reilley, C.N. Anal. Chem. 1981, 53, 1251A.
3. Koller, K.; Hawkridge, F.M. J. Electroanal. Chem. 1988, 239, 291-306.
4. Ikeshoji, T.; Taniguchi, I.; Hawkridge, F.M. J. Electroanal. Chem. 1989, 270, 297- 308.
5. Long, R.C.; Hawkridge, F.M.; Chlebowski, J.F.; Hartzell, C.R. J. Electroanal. Chem. 1988, 256, 111-125.
6. Laemmli, U.K. Nature (London), 1970, 227, 680-685.
7. Smith, B.J. Methods in Molecular Biology, Vol. 1, Proteins. (J.M. Walker Ed.) Clifton, NJ: Humana Press, 1984.
8. King, B.C.; Hawkridge, F.M. J. Electroanal. Chem. 1987, 237, 81-92.
9. Heineman, W.R.; Meckstroth, M.L.; Norris, B.J.; Su, C.H. Bioelectrochem. Bioenerg. 1977, 4, 512.
10. Yuan, X.; Hawkridge, F.M.; Chlebowski, J.F. J. Electroanal. Chem. 1993, 350, 29- 42.
11. Kotz, J.C.; Purcell, K.F. Chemistry and Chemical Reactivity. Orlando, FL: Saunders College Publishing, 1991.
12. Tominaga, Masato. Electrochemistry of Myoglobin. (Unpublished Results), 8/19/92.
13. Nicholson, R.S. Anal. Chem. 1965, 37, 1351-1355.